
Scale-up & cost-down
The volume arrived. The margin did not.
“We doubled the volume and gross margin went backward. Where does the cost actually come out?”
▸ Read the thinking first: the price is already falling
A spend map, should-cost models, and a cost-out program phased against the price curve rather than against the calendar.
What it looks like from the inside
- Volume doubled and gross margin went the other way
- A cost-down number in the plan with no spend map underneath it
- Prices negotiated against last year’s price rather than against what the part should cost
- Savings claimed in the monthly review that never arrive in the P&L
- Agreements renewed at the moment of maximum leverage with no step-downs written into them
The method
Sequence first. Cost-down is the second track under scale-up, and the order is not negotiable: before there is volume there is nothing to trade, and a cost-out program run against a supplier who is not yet winning anything is a request for a discount. But the bricks get laid while you are still scaling. The supply agreements signed during a ramp are the ones that carry the cost-down steps, because that is the moment the supplier wants the volume more than you want the price.
Then the spend map. You cannot take cost out of what nobody has counted. Every category, addressable spend separated from what is fixed by specification or by contract, ranked by size against how quickly it can move. Most programs skip this and start with the three suppliers somebody already finds difficult, which is a ranking by irritation rather than by opportunity.
Should-cost, not price history. Build the number bottom-up — material, process, labor, overhead and a fair margin, by archetype and by country — so the target is anchored in what the part costs to make rather than in what you paid last time. Negotiations change character when the buyer arrives with that number. Anchoring on last year’s price guarantees last year’s cost structure plus inflation.
Cost-out in waves. Not a list of ideas but a phased pipeline: the first wave is commercial and quick, the second is structural — resourcing, consolidation, a second source qualified — and the third needs engineering and therefore needs a design cycle to sit inside. Each wave carries an owner, a date, a value in the plan’s units, and the evidence that will show the value arrived.
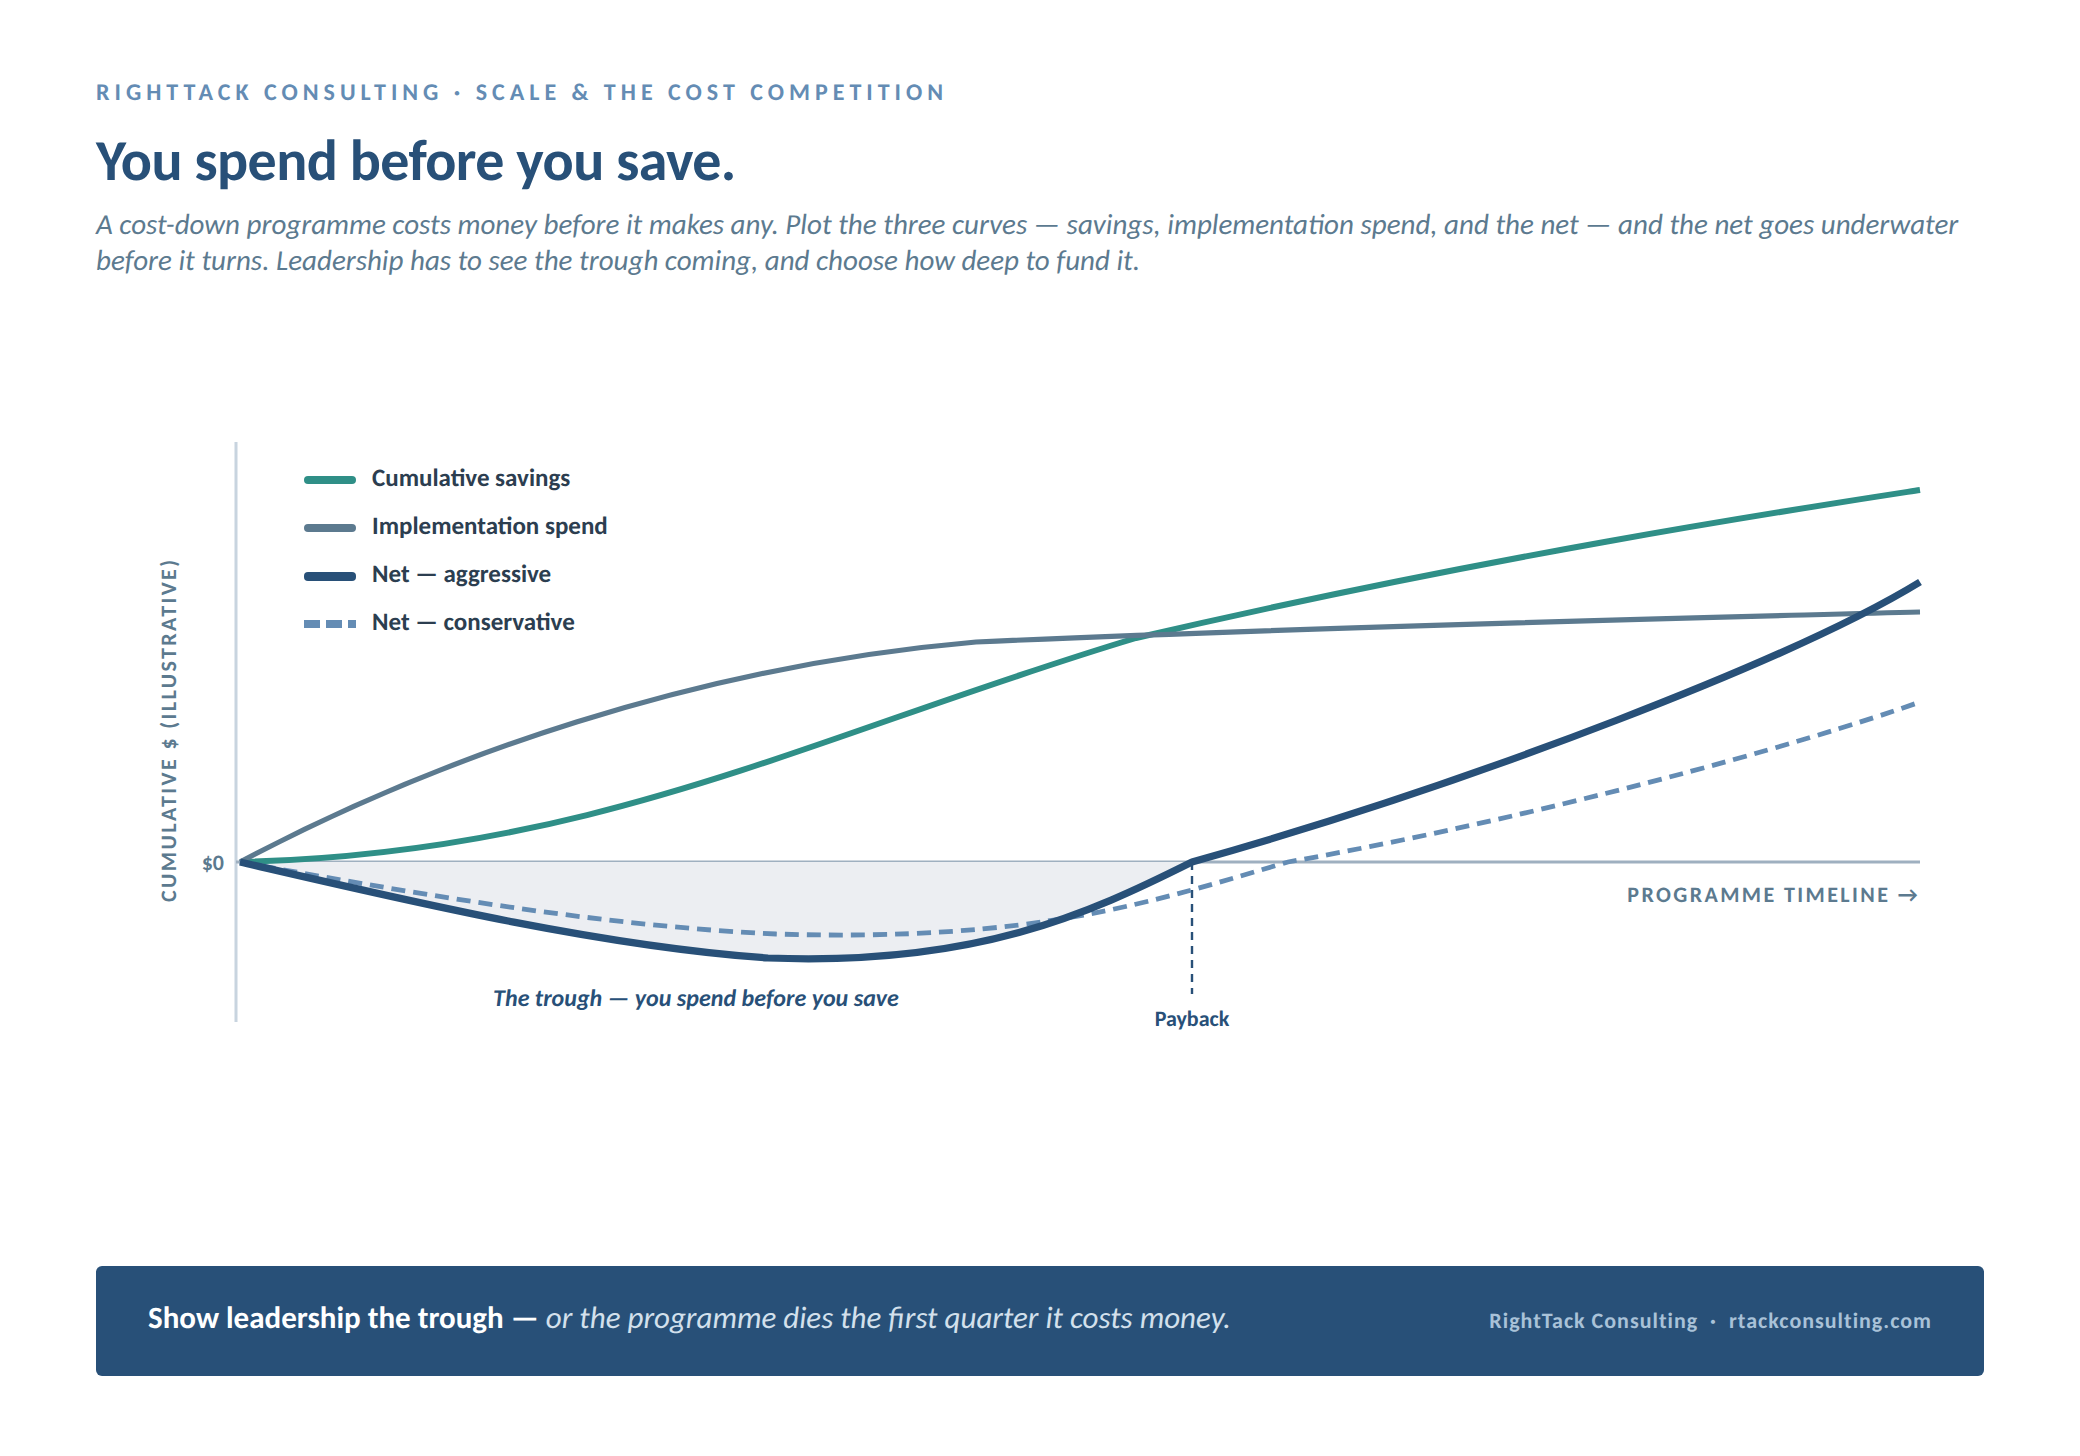
Phasing, and the month the net turns. Savings arrive later than the money spent to get them — qualification, tooling, engineering time, dual-running inventory. Plot savings, spend and net by month and the program stops being a target and becomes a plan somebody can be held to. The month the net turns positive is the number a CFO actually needs, and it is the one most cost-out programs have never worked out.
Cost-down after scale is a program. Cost-down before scale is a wish.
Which is not an argument for waiting. The selling price starts falling the day you launch, so the work that makes cost fall faster has to be under way while the volume is still being won — written into the agreements, not started after them.
None of this survives without the scale-up work in front of it. A ramp that is still fighting yield and expedite freight has no stable cost to attack, and every saving you claim will be swamped by the noise. Get the line steady, then take the cost out — in that order, on the same pillar.
You end up with
A spend map, an anchored target for every category that carries the number, and a cost-out program phased to a month the net turns positive.
- Spend map with addressable spend separated out and categories ranked by size against mobility
- Should-cost models — archetype × country, built bottom-up — for the categories that carry the number
- Cost-out pipeline in waves, each line with an owner, a date, a value and the evidence of realization
- Phasing chart: savings against spend by month, and the month the net turns positive
- Supply agreements with the cost-down steps written in, signed while the volume is still being awarded

